Thinqloud AdminSalesforce Technology

How do I start debugging an error in Salesforce? This post is dedicated to all the newbie in salesforce who have just started exploring the wide arena of customization that can be done on the force.com platform. Do you often get stumbled when you see an error suddenly popping up while saving a record because of a trigger that you have written or on a recently written Visual force page?
Well, it is very obvious to have errors in the code while development, especially when you are new to apex code development and not at all error messages are self explanatory to conclude to a solution. So, what do we do to resolve the error?
Yes, Debug Log is the solution.
I have seen most neo developers get scared in the name of Debug Log. They would do everything from Google search to post in forums but not go through the Debug Log. Debug Log redirects us to the source of the error.
Once you are comfortable reading the Debug and understand the key techniques of error solving, you can analyse any error and find the root cause.
In this blog, we will focus on the techniques to be used to avoid obvious errors and then how to be comfortable with the Debug log.
These are some of key techniques or principles that you can follow to minimize errors while coding –
1. Minimize the need to debug – Build your code hierarchically and in a modular fashion which will minimize the need to debug at the first place. 2. Think like a Tester – Try to think through all the positive and negative use cases and document them as unit test cases to rule out any missed scenarios even before you start writing the code. **3. Let your diagrams come out First **– Get into a habit of designing your code with a carefully conceived flowchart/sequence diagrams and class diagrams representing your logic or requirement. 4. Follow a Design Pattern – For all complex business logic, break your code into layers for ease of maintenance, easy to scale and debug. SOC (Separation of Concern) is what I recommend for Apex and Factory Pattern for Triggers which gives the flexibility to turn on/off business logic. **5. Push out the Runtime Exceptions **– Try to avoid all runtime exceptions like NullPointer, IndexOutOfBoundsException and have all the necessary validations done on the code. 6. Do it right the first time – Last but not the least and is a very important principle. Revisit all the best practices, have that engraved in you and follow them from the very first line of code.
*** What is captured in a Debug Log?** A debug log can record database operations, system processes, and errors that occur when executing a transaction or running unit tests. Debug logs can contain information about:
*** How to access a Debug Log?** Debug logs can be accessed either from
1. Setup>Monitor>Logs>Debug Log – The User has to be set with the datetime range within which the transaction would be executed or else entry would not be recorded. **2. Developer Console **– Logs open in Log Inspector. Log Inspector is a context-sensitive execution viewer that shows the source of an operation, what triggered the operation, and what occurred afterward. Use this tool to inspect debug logs that include database events, Apex processing, workflow, and validation logic.
*** Simple Steps to start Debugging** Step 1 – Knowing the prerequisites
1. Open Log – The formatted log file with the options to filter based on keyword, view debug only, execution points. Recommended
2. Open Raw – The detailed log file
3. Download Log – Option to download the detailed log file.

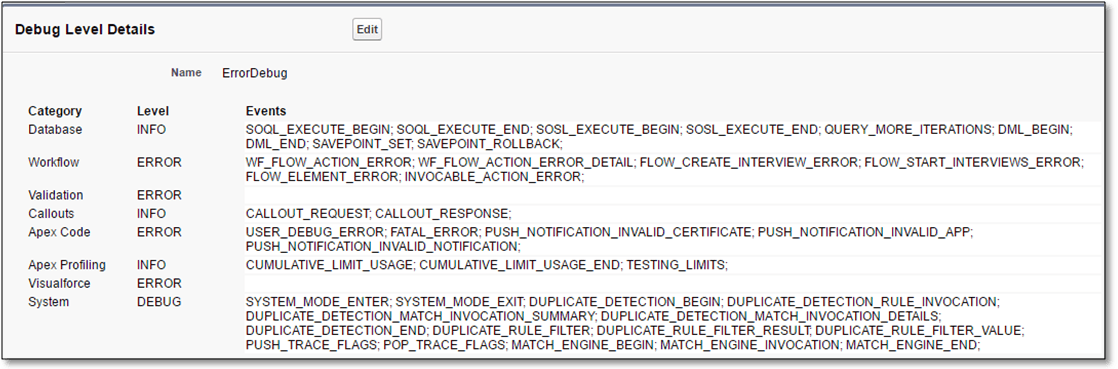
- Understanding the Trace Flags and Debug Levels To specify the information captured in a debug log, debug level and trace flag needs to be set for a user.
- Debug Levels – Each debug level includes one of the following log levels for each Log Category. The levels are listed from lowest to highest
Log Levels
Log Categories
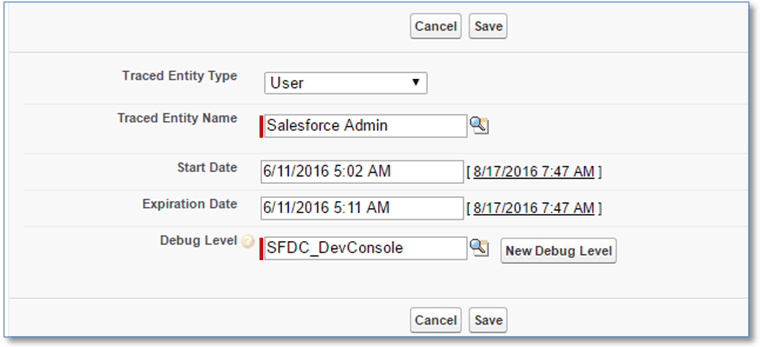
- Trace Flag – It is required to be set for a user to produce Debug Logs. A trace flag includes **a debug level, a start time, an end time, and a log type. **The log types are DEVELOPER_LOG, USER_DEBUG, and CLASS_TRACING. A standard SFDC_DevConsole debug level is shared by all DEVELOPER_LOG trace flags in the org
A debug log has the following sections –
<u>- Header</u> – The header contains the following information.
<u>- Execution Units</u> – An execution unit is equivalent to a transaction. It contains everything that occurred within the transaction. EXECUTION_STARTED and EXECUTION_FINISHED delimit an execution unit. <u>- Code Units</u> – A code unit is a discrete unit of work within a transaction. For example, a trigger is one unit of code, as is a webService method or a validation rule. CODE_UNIT_STARTED and CODE_UNIT_FINISHED delimit units of code. Units of work can embed other units of work. <u>- Log Lines</u> – Log lines are included inside units of code and indicate which code or rules are being executed. Log lines can also be messages written to the debug log. <u>- Other Information</u> – The log also contains information regarding
Sample Log File
28.0 APEX_CODE,FINEST;APEX_PROFILING,INFO;CALLOUT,INFO;DB,INFO;SYSTEM,DEBUG;VALIDATION,INFO;VISUALFORCE,INFO;WORKFLOW,INFO 06:39:44.0 (497737)|USER_INFO|[EXTERNAL]|005P0000001IlQR|jinaxxxx@xxxxxxxxx|Eastern Standard Time|GMT-04:00 06:39:44.0 (551067)|EXECUTION_STARTED 06:39:44.0 (557744)|CODE_UNIT_STARTED|[EXTERNAL]|066d0000001yiuM|VF: /apex/ForecastVsActual 06:39:44.0 (9354860)|SYSTEM_MODE_ENTER|true 06:39:44.0 (9852436)|HEAP_ALLOCATE|[72]|Bytes:3 06:39:44.0 (9915332)|HEAP_ALLOCATE|[77]|Bytes:152 06:39:44.0 (9935344)|HEAP_ALLOCATE|[342]|Bytes:408 06:39:44.0 (9953745)|HEAP_ALLOCATE|[355]|Bytes:408 06:39:44.0 (9970882)|HEAP_ALLOCATE|[467]|Bytes:48 06:39:44.0 (723237895)|VARIABLE_ASSIGNMENT|[EXTERNAL]|this|{"CurrDate":"2016-08-17T00:00:00.000Z","dummyAcc":"0x512ac13","month":"0x62303a5b","numRows":0,"selectedAlphabet":"A","selectedCustType":"Both","selectedYear":"2016","summRowIndex":"0x8fee0eb","thismonth":8,"thisyear":2016,"unitMonth":"0x7e02f5da"}|0x505c60d3 06:39:44.0 (723289332)|HEAP_ALLOCATE|[310]|Bytes:120 06:39:44.0 (723356053)|VARIABLE_ASSIGNMENT|[EXTERNAL]|this|{"CurrDate":"2016-08-17T00:00:00.000Z","dummyAcc":"0x512ac13","month":"0x62303a5b","numRows":0,"selectedAlphabet":"A","selectedCustType":"Both","selectedYear":"2016","summRowIndex":"0x8fee0eb","thismonth":8,"thisyear":2016,"unitMonth":"0x7e02f5da"}|0x505c60d3 06:39:44.0 (723399946)|HEAP_ALLOCATE|[310]|Bytes:120 06:39:44.0 (723460895)|VARIABLE_ASSIGNMENT|[EXTERNAL]|this|{"CurrDate":"2016-08-17T00:00:00.000Z","dummyAcc":"0x512ac13","month":"0x62303a5b","numRows":0,"selectedAlphabet":"A","selectedCustType":"Both","selectedYear":"2016","summRowIndex":"0x8fee0eb","thismonth":8,"thisyear":2016,"unitMonth":"0x7e02f5da"}|0x505c60d3 06:39:44.0 (749003340)|VARIABLE_ASSIGNMENT|[EXTERNAL]|this|{"AccId":"","AccName":"Summary - ","AccType":"","isSummary":true,"strStyleClass":"summaryRowx","xc":"0x6f5e7d95"}|0x44ae41b9 06:39:44.0 (847259119)|SYSTEM_MODE_ENTER|true 06:39:44.0 (895274477)|VF_SERIALIZE_VIEWSTATE_BEGIN|066d0000001yiuM 06:39:44.0 (908887836)|VF_SERIALIZE_VIEWSTATE_END 06:39:44.921 (921787493)|CUMULATIVE_LIMIT_USAGE 06:39:44.921 (921787493)|LIMIT_USAGE_FOR_NS|(default)| Number of SOQL queries: 3 out of 100 Number of query rows: 2 out of 50000 Number of SOSL queries: 0 out of 20 Number of DML statements: 0 out of 150 Number of DML rows: 0 out of 10000 Maximum CPU time: 0 out of 10000 Maximum heap size: 0 out of 6000000 Number of callouts: 0 out of 100 Number of Email Invocations: 0 out of 10 Number of future calls: 0 out of 50 Number of queueable jobs added to the queue: 0 out of 50 Number of Mobile Apex push calls: 0 out of 10 06:39:44.921 (921787493)|CUMULATIVE_LIMIT_USAGE_END 06:39:44.0 (921859878)|CODE_UNIT_FINISHED|VF: /apex/ForecastVsActual 06:39:44.0 (923528947)|EXECUTION_FINISHED
<u>3. Step 3 – Set the Log Levels</u> Debug logs have a limit of 2 MB and often you might hit the limit for bigger functionality. The log captures the last portion of the file. Check if you have ‘Skipped lines of code’, in case you have that the debug log is truncated. So it is necessary to set the appropriate log level. If you are only debugging Apex code, you can set all the Log Categories to ‘None’ and Apex Code to ‘Debug’.
If the error still persists, there are option to set Log Level for specific Classes and Triggers and setting the entire Debug Level to ‘None’.
<u>4. Step 4 – Add Meaningful Debug Statements</u>
Debug Statements should be added at strategic points to help you identify the error. You can have them at each entry and exit points and have meaningful and searchable text so that they can be easily located in the Debug.
You can also log Debug Statements as Error instead of Debug for bigger logs to help you locate the debugs
Use System.debug(LogLevel.ERROR, ‘Error Message’).
<u>5. Step 5 – Use of execute anonymous blocks</u> Use the ‘Execute Anonymous’ window of Developer console to run specific classes and methods within the class to reproduce the issue.
<u>6. Step 6 – Follow the Rule of Elimination</u> In case you are not able to find the exact location of the error, follow the ‘Rule of Elimination’. Start with minimal code and keep adding the code to help you identify the exact location. Test Classes is also another great way to identify the issues with various combinations of test data.
References https://developer.salesforce.com/docs/atlas.en-us.apexcode.meta/apexcode/apex_debugging_debug_log.htm
https://developer.salesforce.com/docs/atlas.en-us.apexcode.meta/apexcode/apex_debugging_system_log_console.htm