
Real-Time Org Limit Analyzer
AI-Powered Salesforce Limit Monitoring & Alerting
Know when your org is approaching its limits — before integrations fail and automation stops.
See It In Action
Watch how the Real-Time Org Limit Analyzer monitors Salesforce limit consumption, evaluates it against tiered thresholds, and surfaces AI-generated remediation guidance — automatically on a schedule.
Real-Time Org Limit Analyzer — Demo
Why Org Limit Breaches Catch Teams Off Guard
How the Real-Time Org Limit Analyzer Works
Step 1 — Snapshot captured for every monitored limit
OrgLimitsService reads every available System.OrgLimit on each scheduled run, maps each to a business category (API, Email, Storage, or Org), calculates remaining value, percentage used, and health status, then writes a Limit_Snapshot__c record for every limit on every run — powering historical trend charts on the dashboard.
Step 2 — Thresholds evaluated and alerts opened or updated
LimitAlertService compares current utilization against four threshold tiers. For each breached limit, existing alerts are refreshed in place if severity is unchanged, stale alerts are auto-resolved and replaced when severity escalates, and alerts are automatically resolved when usage returns to healthy levels — ensuring only one active alert exists per limit at any time.
Step 3 — AI recommendation generated for every new alert
Every new alert triggers an immediate callout via Named Credential to OpenAI GPT-4o through OpenAILimitRecommendationService. A structured prompt — containing the limit name, category, percentage used, and status — returns four sections: root cause, business impact, recommended action, and prevention steps. If the AI callout fails, a fallback recommendation is applied automatically so alert creation is never blocked.
Step 4 — Alerts auto-resolved when usage returns to healthy levels
When utilization drops below the CAUTION threshold, Is_Resolved__c is set and Resolved_At__c is populated automatically. Only one active alert per limit exists at any time — resolved alerts are never reopened; a new one is created if the limit rises again.
| Status | Trigger condition | Threshold stored |
|---|---|---|
| CRITICAL | Utilization ≥ 90% | 90 |
| WARNING | Utilization ≥ 75% and < 90% | 75 |
| CAUTION | Utilization ≥ 50% and < 75% | 50 |
| OK | Utilization < 50% | — |
Limits Monitored Across Four Categories
Every available System.OrgLimit is read on each run and mapped to one of four business categories. Any limit not explicitly mapped defaults to the Org category — ensuring no limit goes unmonitored as Salesforce adds new platform limits over time.
| Category | Limits monitored |
|---|---|
| API | DailyApiRequests, DailyBulkApiRequests, DailyBulkApiRequestsHigh, DailyStreamingApiEvents, DailyGenericStreamingApiEvents |
| DailySingleEmail, DailyMassEmail, DailyWorkflowEmails | |
| Storage | DataStorageMB, FileStorageMB |
| Org | DailyAsyncApexExecutions, DailyScheduledApexExecutions, HourlyPublishedPlatformEvents, ActiveScratchOrgs, DailyDeliveredPlatformEvents, HourlyTimeBasedWorkflow, and any unmapped limit |
Functional Flow Diagram
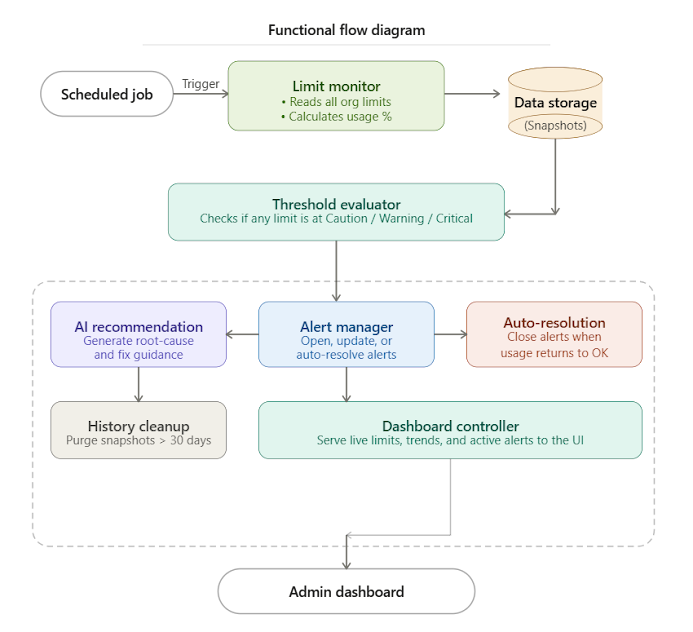
Functional flow: from scheduled snapshot capture through threshold evaluation, AI recommendation generation, and auto-resolution of alerts.
Technical Solution Overview
The Real-Time Org Limit Analyzer is an AI-powered solution built natively on Salesforce. The system autonomously runs end-to-end — continuously monitoring every governor limit across the org, evaluating consumption against tiered thresholds, generating AI-powered remediation guidance, and surfacing live health status to administrators — rather than waiting for manual checks or reacting after a limit has already been breached.
Each capability is delivered through Salesforce technologies as follows:
Architecture principle: Deterministic Apex guarantees accurate limit reading, threshold evaluation, and alert record management for anything that directly reflects org health data; the AI layer via OpenAI GPT-4o handles contextual remediation language and actionable guidance per alert; and the scheduled orchestration layer makes the system truly proactive — running continuously on its own and surfacing risk before limits are breached, rather than waiting for an outage to prompt investigation.
Key Features
Automated Scheduled Monitoring — No Manual Initiation
The monitoring cycle runs automatically on a configured schedule. There is no report to trigger, no dashboard to refresh manually, and no process to initiate. Each run captures, evaluates, and alerts without any administrator action.
Intelligent Alert Lifecycle — Open, Update, and Auto-Resolve
Alert records are managed automatically through their full lifecycle. A limit can only have one active alert open at any time — the system resolves stale alerts, refreshes existing ones, and never creates duplicate noise.
AI Remediation Per Alert — Root Cause and Action in Every Record
Every new alert record is enriched with an AI-generated recommendation covering root cause, business impact, the recommended action to take, and prevention steps. Admins receive actionable guidance immediately — no manual investigation required.
Live Lightning Dashboard — Full Org Health in One Screen
A custom Lightning Web Component dashboard surfaces current limit status, historical trends, and active alerts in a single screen — embeddable on any Lightning page or app home page.
Business Impact
The Real-Time Org Limit Analyzer shifts org limit management from a reactive, manual activity to a proactive, automated process — giving admins, architects, and leaders the visibility they need before limits affect users.